
Low-impact production


Our ambition: Brunvoll will ensure minimal environmental impact in our facilities and value chain, from material procurement to end-of-life. We will continuously work to reduce our GHG emissions and material footprint.
Our achievements in 2024
- Power consumption from electricity has decreased since we installed a solar plant on our factory roof in Molde. In 2024, it produced 1.05 million kWh.
- We used sustainable concrete when preparing the foundations at two of our factories for the installation of new large machines. This reduced the project’s CO2 footprint by 155 tonnes.
- We produced 98% of machined spare parts for our products in-house, reflecting increased production capacity.
Modern production and integrated value chain
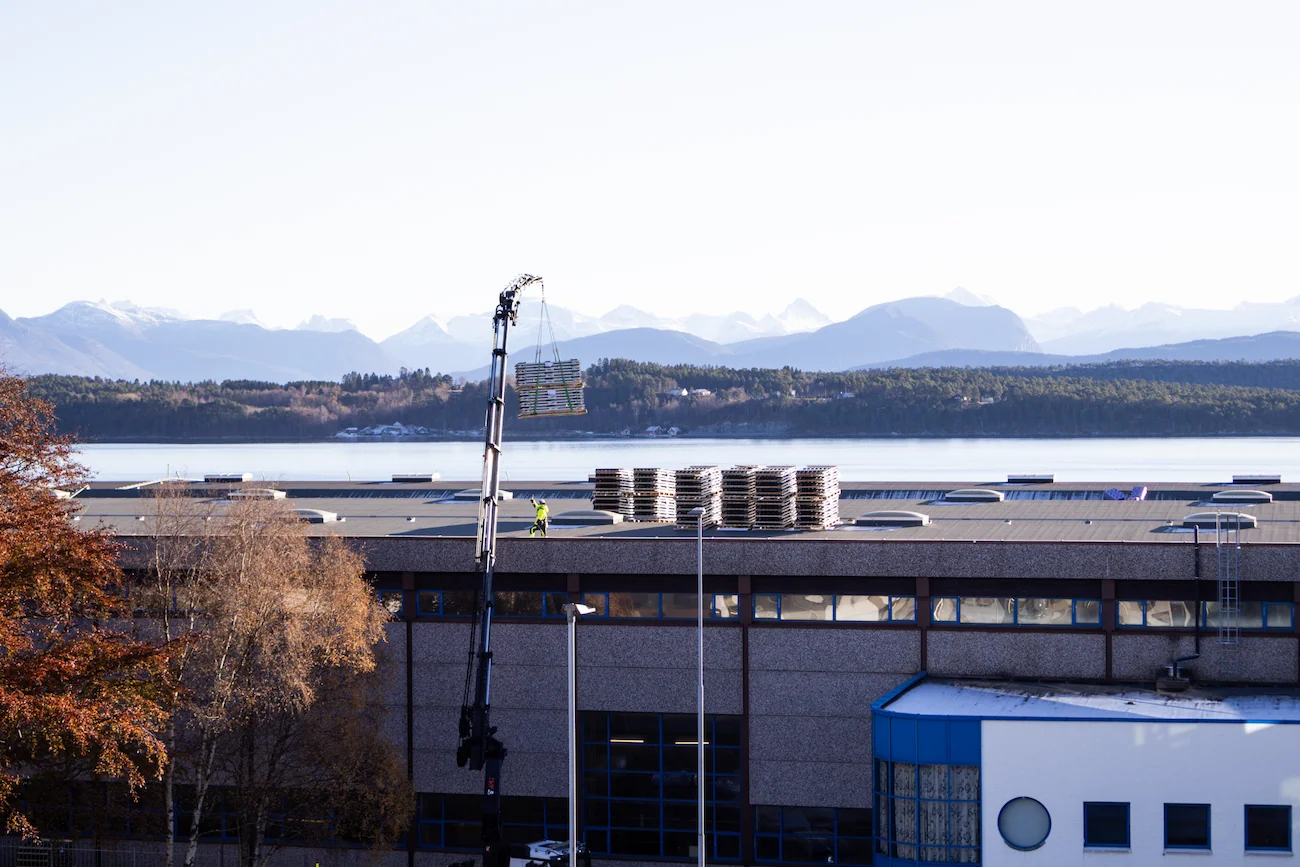
We focus on in-house production in our Molde, Volda and Dalen facilities, avoiding outsourcing important skills and knowledge. Investments in modern production technology and lean principles help us continuously improve our productivity, which is essential when producing in a high-cost country.
Our philosophy is that an integrated value chain provides a competitive benefit, granting us control, flexibility and capabilities in daily operations and for innovation.
Responsible supply chain
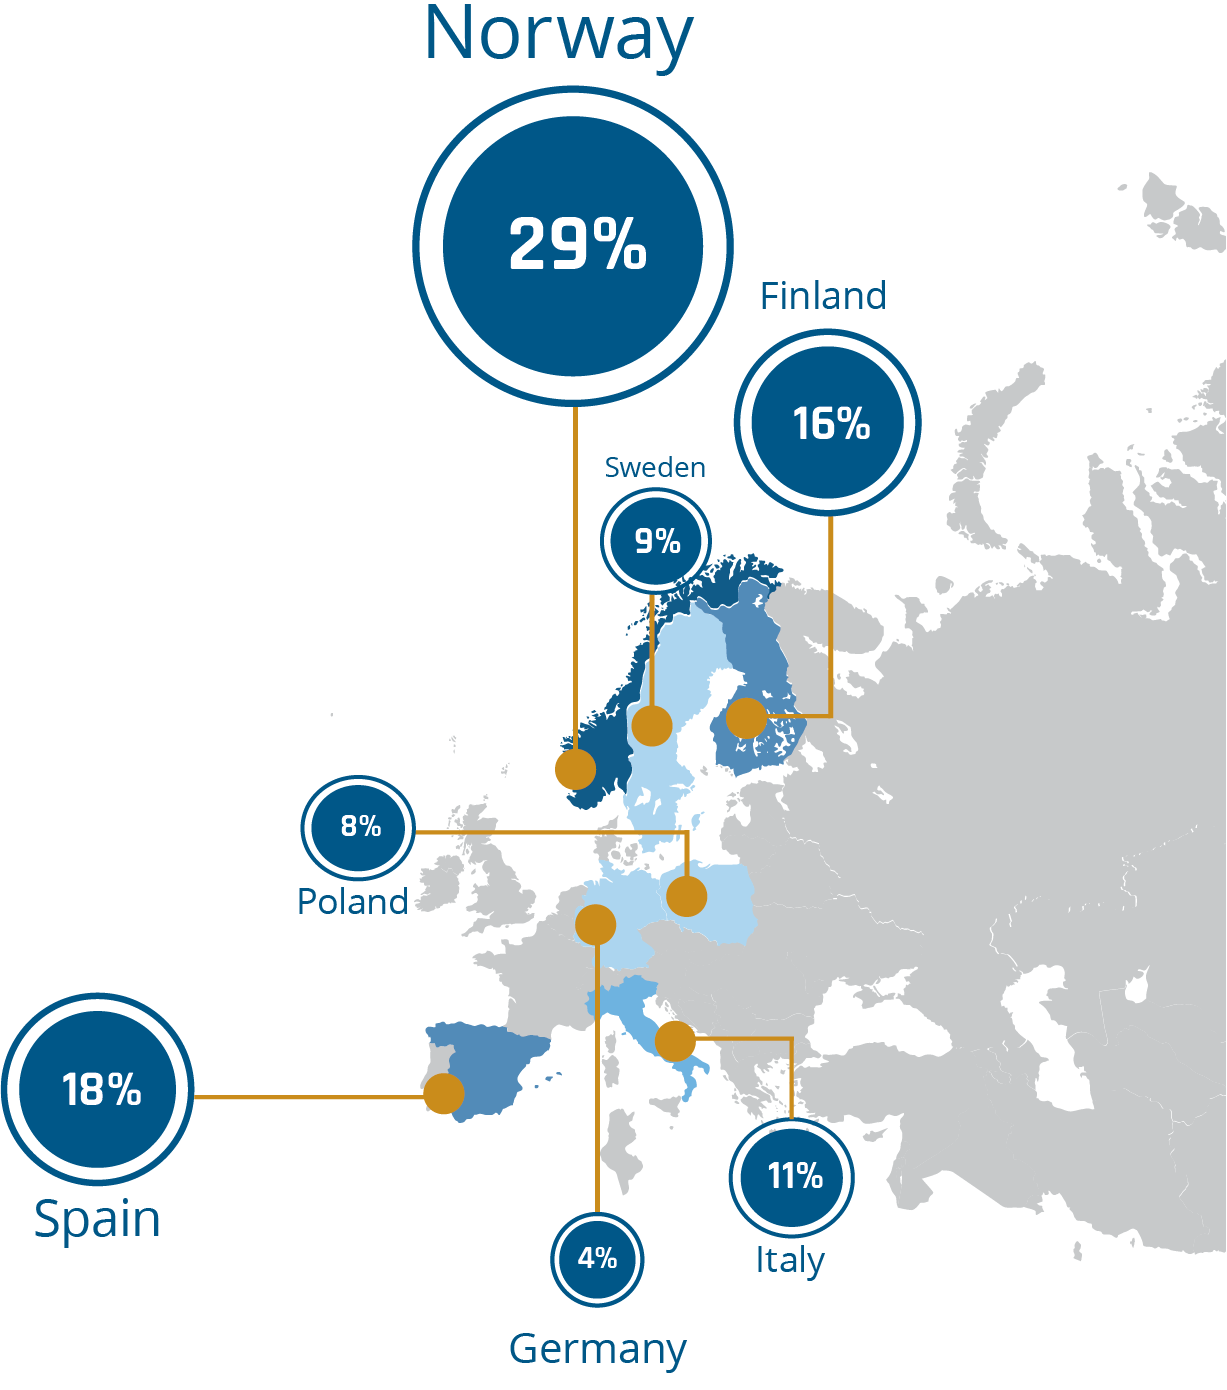
Brunvoll’s suppliers are subject to our environmental criteria and screening on quality, price and delivery precision. According to our purchase strategy, we focus on long-term partnerships with key suppliers and have a preference for Nordic and European suppliers. We source the majority of the steel and castings in the Nordics and the remaining in Europe, as shown in the infographic. As steel and castings are the main drivers of our scope 3 emissions, we believe in this strategy to secure long-term delivery performance and quality, as well as keeping emissions at a minimum.
Our suppliers are familiar with our ethical guidelines, and it is a prerequisite that they comply with international law on wages, working conditions and health & safety. Our supplier mapping shows that a large portion (>80%) of our Tier 1 suppliers are in the Nordics and northern Europe. We have a high ratio of upstream goods transported by truck and downstream goods transported by sea freight. 2023 was the first year we measured emissions from the transportation of goods.
Suppliers mapping steel and castings
Material consumption and circularity
A large proportion of our Scope 3 emissions is found in the life cycle of purchased goods, noticeable in our consumption of metals such as steel, cast iron and bronze alloys. Our goal is to measure and increase the fraction of recycled content in our input materials to support the development of a more circular economy and lower the footprint of our products. A parallel goal is to use less materials by increasing resource efficiency. Our emissions from purchased goods amounted to 15,314.8 tCO2e in 2024, an increase of 5,087.6 tCO2e compared to 2023.
Waste
We have a well-functioning waste management system in place. We sort and deliver multiple fractions of excess material to proper waste management companies. In 2023, we sent 1067 tons of waste to recycling. 82,1 tons were incinerated (energy recovered), while only 17,4 tons were sent to a landfill.
In 2022, we stated that our ambition is to continuously decrease the total amount of waste generated and to increase the amount of sorted waste sent to further processing to 80%. In 2023, the sorted waste sent to further processing was 93,8% - far more than our initial goal.
_no-total.svg)
1,539.0 tons (90.3%)
142.5 tons (8.4%)
23.3 tons (1.4%)
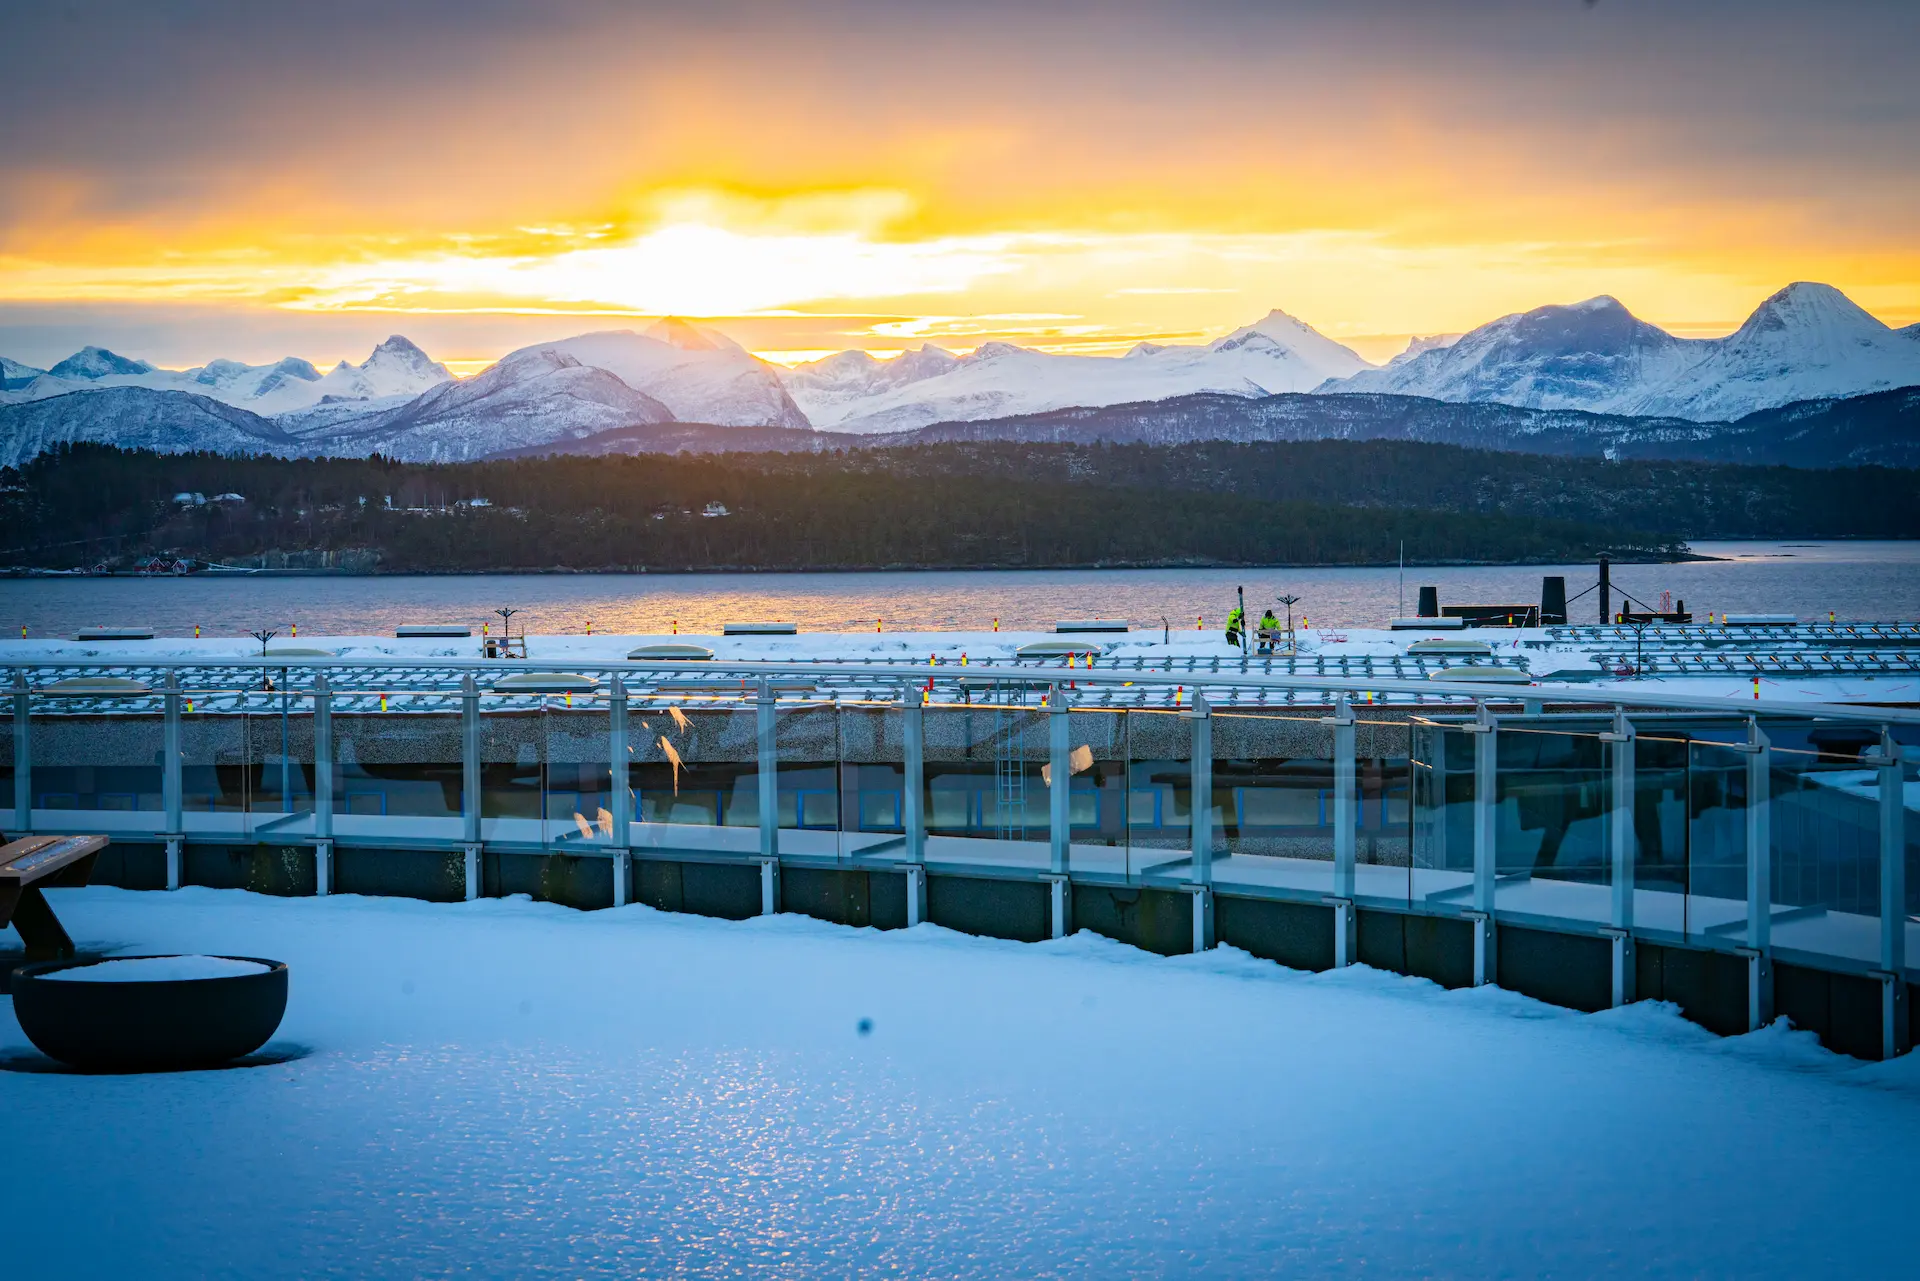
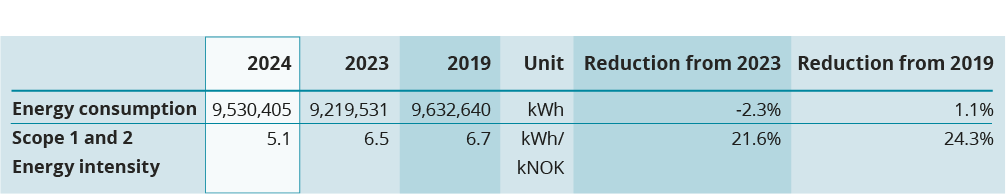
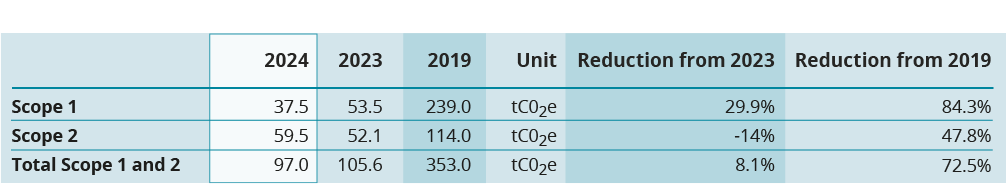
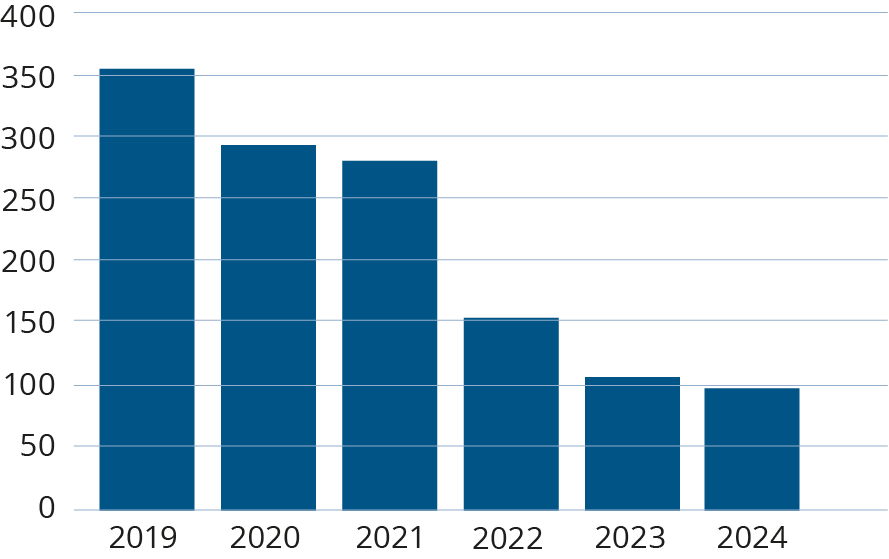
Energy consumption and carbon footprint from operations
The energy consumption at our facilities is primarily covered by purchased electricity (55.5%) and diesel (38.5%). These two categories have increased slightly in tonnes of CO2 equivalents since 2023. That year, we made investments to reduce our direct emissions and produce our own solar power. We have installed 7,400 square metres of solar panels at our factory in Molde, and this investment will lead to an annual energy production of 1,350,000 kWh. This equals about 25% of the factory’s electrical power consumption. In total, our yearly solar energy production will equal the electricity required to run about 70 private homes.
Norway is nearly self-sufficient with hydroelectric power, allowing industries like ours to create value with low scope 1 and 2 emissions. Our solar roof has also made an enormous impact, providing us with 1,048,193 kWh of energy from March through December, of which 73.6% was used to power our own factory.
Nonetheless, energy is a resource that we must use with care. By 2025, we aim to decrease our overall energy intensity by 5%.

55.5% (53.8 tCO2e)
38.5% (37.3 tCO2e)
0% (0 tCO2e)
5.9% (5.7 tCO2e)
0.2% (0,2 tCO2e)
What do we mean by Scope 1, 2 and 3?
Scope 1: Direct emissions from our facilities and vehicles.
Scope 3: Indirect emissions that occur in the value chain of our company.
Scope 2: Indirect emissions from generation of purchased energy for own use.
2023 was the very first year in which we reported on Scope 3 emissions. Scope 3 includes emissions a company is indirectly responsible for along its value chain, originating from activities not directly owned or controlled by the company. This encompasses processes such as the procurement, usage, and disposal of products obtained from suppliers.
Essentially, Scope 3 emissions cover all sources beyond the company’s direct operational boundaries, distinct from Scope 1 and 2 emissions. In 2024, our Scope 3 emissions amounted to 16,325 tCO2e, an increase of 5,112 tCO2e. This is related to the fact that this is the first year of emissions reporting for the transport of goods and purchased goods for all operating locations. In addition, we see improvement in data quality from our suppliers. Our order volume has increased significantly over the last few years, which explains the rise in Scope 3 emissions.
.svg)
94% (15,314.8 tCO2e)
5.0% (887.9 tCO2e)
1% (122 tCO2e)
Greenhouse Gas emissions per Value Added (GEVA) is a measure of emissions (tCO2e) divided by Value Added (Revenue + payroll) in MNOK. An annual 5% reduction in GEVA is accepted as a guideline for corporate alignment with the goals in the Paris Agreement (Randers 2012 and OECD 2012). From 2023 to 2024, we had a reduction in GEVA by 25%.
End of life
Our products are built to last, often outliving the ships they are installed into. Our products have long lifecycles and are designed for maintenance and technical upgrades. At the end of the life of a ship, our products are recycled or sold on a second-hand market. We are following the market trends and possibilities within future business models where an even higher degree of circularity may be achieved. We are curious about the business case of leasing our products and the potential for capturing value that previously have been lost at end-of-life through refurbishment rather than recycling.
Further reading


